
Why AVO-Detect?
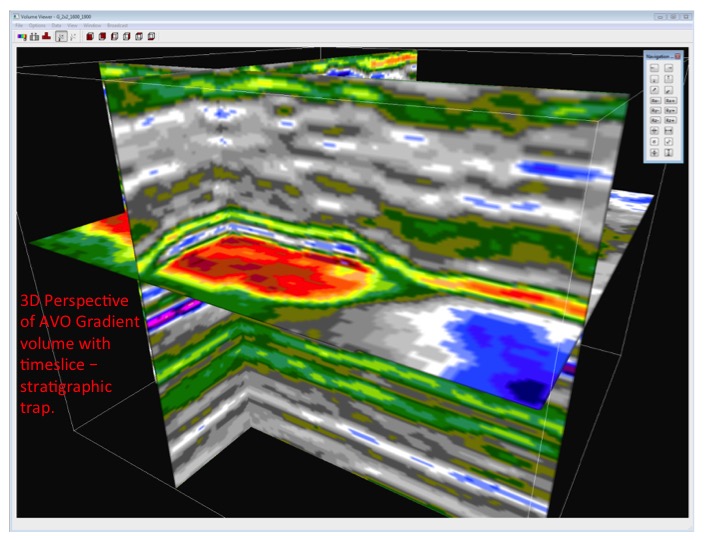
People tend to think of AVO as a tool to predict fluid content, primarily gas, but AVO can be used for much more. AVO is a pre-stack attribute, a function of rock properties and acquisition geometry. The AVO response is a complex function of the physical propertiesof the overlying and underlying rock at an interface. If we assume that the properties of the overlying rock are constant, then the AVO response is a function of changes within the underlying rock. These changes may be a result of the change in fluid content, but the changes can just as easily be because of a variation in the physical properties of the underlying rock. The changes may be stratigraphic (change in rock type/depositional environment), porosity related, or even influenced by existing fractures. Thus, defining an AVO anomaly is just the first step in deciding whether one has a viable exploration or development target. Is it a gas filled reservoir? A porous channel deposit? High porosity zone within a reef? Or maybe an area of increased fracture density in tight reservoir?
Please check out AVO-Detect. We believe it can be a useful tool to help you in making exploration and development decisions. We think you will like it.
Call or email us with your questions.
Features:
- Load Pre-Stack & Post-Stack Seismic Data
- Import Horizons from Interpretation Package
- Basic Picking Options
- Create & Use Super Gathers – You Select the Size
- Compute Intercept & Gradient (Horizon/Volume)
- Compute Intercept & Gradient vs Azimuth
- Cross-Plot Intercept, Gradient & Other Attributes
- Determine Fluid Factor Angle
- Graph Amplitude versus Offset, Angle, Sin 2 Angle
- Compute Fluid Factor, Lithology Factor, Porosity Factor, AVO Class & Other Attribute Grids & Volumes
- With Built-In Script Tool (Python) Compute Unique Grid &
Volume Attributes - Compute Semblance (Post-Stack Data, coherency measure)
- Display All in Map, Section, Timeslice, 3D Volume View
- 3D Visualization of Seismic & Attributes
- Project Points from any Display ( Seismic Viewer, Amplitude vs. Offset Plot, Map/Grid Viewer, 3D Viewer, Crossplot) to all others
- Generate TimeSlices of Volumes & Flatten
- Export Map Grids & Volumes for Import
- Export/Attach SeisWare-compatible Attribute Volumes
- And More…..
